📚 Trusted by students, educators & researchers since 2017.

Quartiles are one of the most frequently used methods to split data and understand its spread.
In general, data can be divided into various groupings so that an equal number of points fall into each bucket. These division points are called quantiles. If quantiles divide the data into 100 groups, they’re called percentiles. If they divide it into 10 groups, they’re deciles. In the case of quartiles, as the name implies, the data is divided into four equal groups.
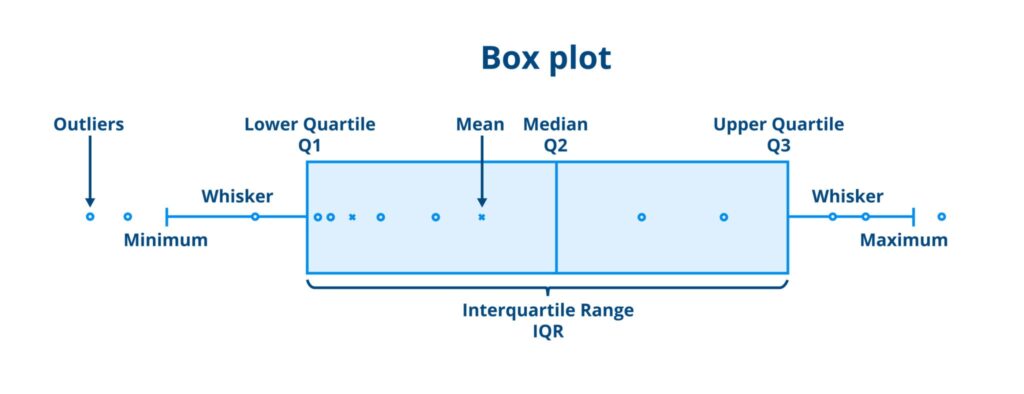
Because each quartile separates 25% (or one quarter) of the dataset, they are directly tied to percentiles. The 1st quartile (Q1) is the 25th percentile, the 2nd quartile (Q2) is the 50th percentile (the median), and the 3rd quartile (Q3) is the 75th percentile.
The Excel Update: .INC vs .EXC
Until about a decade ago, calculating quartiles in Microsoft Excel was a relatively uncomplicated affair. You would type =QUARTILE, provide the data range and the quartile number, and the desired value would pop out. Easy peasy!
However, Microsoft eventually introduced a change to the formula that resulted in some confusion. Instead of just one formula, there are now two:
=QUARTILE.EXC(Quartile Exclusive)=QUARTILE.INC(Quartile Inclusive)
Why the split? It comes down to a long-standing debate among statisticians regarding percentiles. Some argue percentiles should be calculated as “greater than or equal to” a value, while others argue they should be strictly “greater than.” Rather than take sides and become the target of hate from one of the camps, Excel chose to provide both options.
The Core Difference: How to Handle the Median
To understand the difference, we have to look at how quartiles are actually found.
The 2nd quartile (Q2) cuts the dataset into two equal halves. Simply put, Q2 is the median of the dataset. Once the dataset is cut into two parts, each part has its own median. The median of the lower half is Q1, and the median of the upper half is Q3.
The difference between inclusive and exclusive calculations comes down to what you do with the dataset’s overall median when calculating those halves.
- Quartile Inclusive (
.INC): Uses the “greater than or equal to” approach. The median value is included in both the lower and upper halves when calculating Q1 and Q3. It also includes the extreme values, meaning it can calculate the 0th quartile (the absolute minimum) and the 4th quartile (the absolute maximum). - Quartile Exclusive (
.EXC): Uses the strictly “greater than” approach. The overall median is excluded from both halves. It also excludes the extreme boundaries, meaning if you try to calculate the 0th or 4th quartile using.EXC, Excel will throw a#NUM!error.
A 5-Point Example
Let’s look at a simple dataset with five values: 10, 20, 30, 40, 50.
The median (Q2) is clearly 30. Here is how the two methods handle the rest of the calculations:
| Quartile | .INC (Inclusive) | .EXC (Exclusive) | Why the difference? |
| Q0 (Min) | 10 | #NUM! | Exclusive cannot compute boundaries. |
| Q1 (25th) | 20 | 15 | Inclusive includes 30 in the lower half (10, 20, 30) -> median 20. Exclusive excludes 30 (10, 20) -> median 15. |
| Q2 (Median) | 30 | 30 | The overall median is identical in both methods. |
| Q3 (75th) | 40 | 45 | Inclusive includes 30 in the upper half (30, 40, 50) -> median 40. Exclusive excludes 30 (40, 50) -> median 45. |
| Q4 (Max) | 50 | #NUM! | Exclusive cannot compute boundaries. |
Notice the impact on the Interquartile Range (IQR)—the distance between Q1 and Q3. The exclusive method returns a lower Q1 and a higher Q3, leading to a wider IQR than the inclusive method.
Which One Should You Use?
In nearly all practical, everyday use cases, you should use Quartile Inclusive (=QUARTILE.INC).
It handles boundaries gracefully, includes the median without dropping data, and—if you are dealing with legacy spreadsheets—it mathematically matches the old, standard =QUARTILE(...) formula that Excel used for years.
Quartile Calculation Visualiser
Use this interactive number line to enter your own data points and see exactly how the inclusive and exclusive calculation methods shift the quartile boundaries in real-time.
Quartile Calculation Simulator
Toggle between Inclusive and Exclusive methods to see how the quartile boundaries shift.
| Minimum (Q0) | Q1 (25th) | Median (Q2) | Q3 (75th) | Maximum (Q4) |
|---|---|---|---|---|
| — | — | — | — | — |