📚 Trusted by students, educators & researchers since 2017.

When you first learn statistics, you live in a very simple world. You look at how X affects Y.
Does studying more (X) increase test scores (Y)? Does eating more calories (X) increase weight (Y)?
This is called Bivariate Analysis (analysing two variables). It is clean, it is mathematically straightforward, and in the real world, it is incredibly dangerous.
The real world does not happen in a vacuum. If you only look at two variables at a time, you will inevitably fall victim to statistical illusions. To see the truth, you have to upgrade to Multivariate Statistics.
The Illusion: The Confounding Variable
Let’s look at one of the most famous statistical illusions of all time.
If you collect data at a beach town over a year, you will find a massive, statistically significant positive correlation between Ice Cream Sales and Shark Attacks. As ice cream sales go up, shark attacks go up. As ice cream sales drop, shark attacks drop.
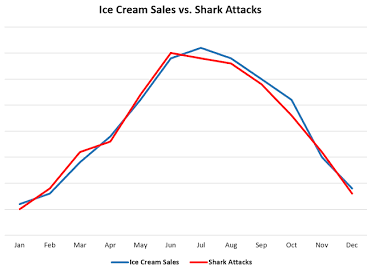
If you only use bivariate statistics, your conclusion is terrifying: Eating ice cream attracts sharks.
But the reality is that a third, invisible variable is secretly controlling both of them: Temperature. When the weather gets hot, more people buy ice cream. When the weather gets hot, more people swim in the ocean (leading to more shark attacks).
Temperature is a Confounding Variable. It is a hidden actor pulling the strings. If you don’t mathematically account for it, you will draw completely false conclusions.
The Solution: Multiple Regression
How do we mathematically fix the ice cream problem? We use a multivariate technique called Multiple Regression.
Instead of just looking at a 2D graph of X and Y, Multiple Regression pulls all the variables into a multi-dimensional space. The math essentially says: “I am going to look at the relationship between Ice Cream and Shark Attacks, but I am going to hold the Temperature constant.”
Imagine fixing the temperature at exactly 34 degrees Celcius. If every day is a 34-degree day, do days with higher ice cream sales still see more shark attacks?
No. Once the temperature is mathematically “locked” in place, the relationship between ice cream and sharks completely disappears.
Multiple regression allows you to untangle the messy web of reality. It lets you isolate the true impact of a single variable while simultaneously mathematically neutralising the effects of age, income, gender, temperature, or anything else that might be muddying the waters.
The Problem: The Curse of Dimensionality
So, if adding variables makes our math more accurate, we should just throw every variable we can find into the equation, right?
Not exactly. This leads to a new problem called the Curse of Dimensionality.
If you are trying to predict the price of a house, you might look at Square Footage, Number of Bedrooms, and Age. That is 3 dimensions. But modern datasets (like predicting customer behavior or analysing genetics) might have 50, 100, or 1,000 variables.
When you have hundreds of dimensions, your data becomes so spread out and mathematically complex that standard statistical models collapse. The noise drowns out the signal.
The Ultimate Trick: Principal Component Analysis (PCA)
When you have too many variables, multivariate statistics gives you a tool to compress reality: Dimensionality Reduction.
The most famous of these tools is Principal Component Analysis (PCA).
Let’s go back to the housing data. “Number of Bedrooms,” “Number of Bathrooms,” and “Square Footage” are technically three different variables, but they all basically measure the exact same underlying concept: House Size.
PCA is a mathematical algorithm that looks at a massive, 50-dimension dataset, finds the variables that overlap, and smashes them together into new, combined super-variables (called Principal Components).
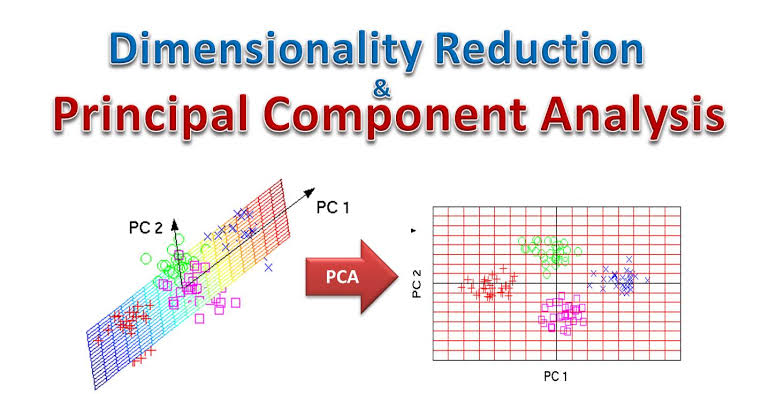
It might take a dataset with 50 variables and compress it down to just 3 Principal Components, while retaining 95% of the original information. It takes an impossibly complex 50-dimensional problem and flattens it into a 3D model that humans (and computers) can actually analyse.
The Golden Rule of Multivariate Stats: Never trust a simple A-to-B correlation without asking, “What else could be causing this?” But when you add those extra variables, you must be prepared to manage the mathematical complexity that comes with them.